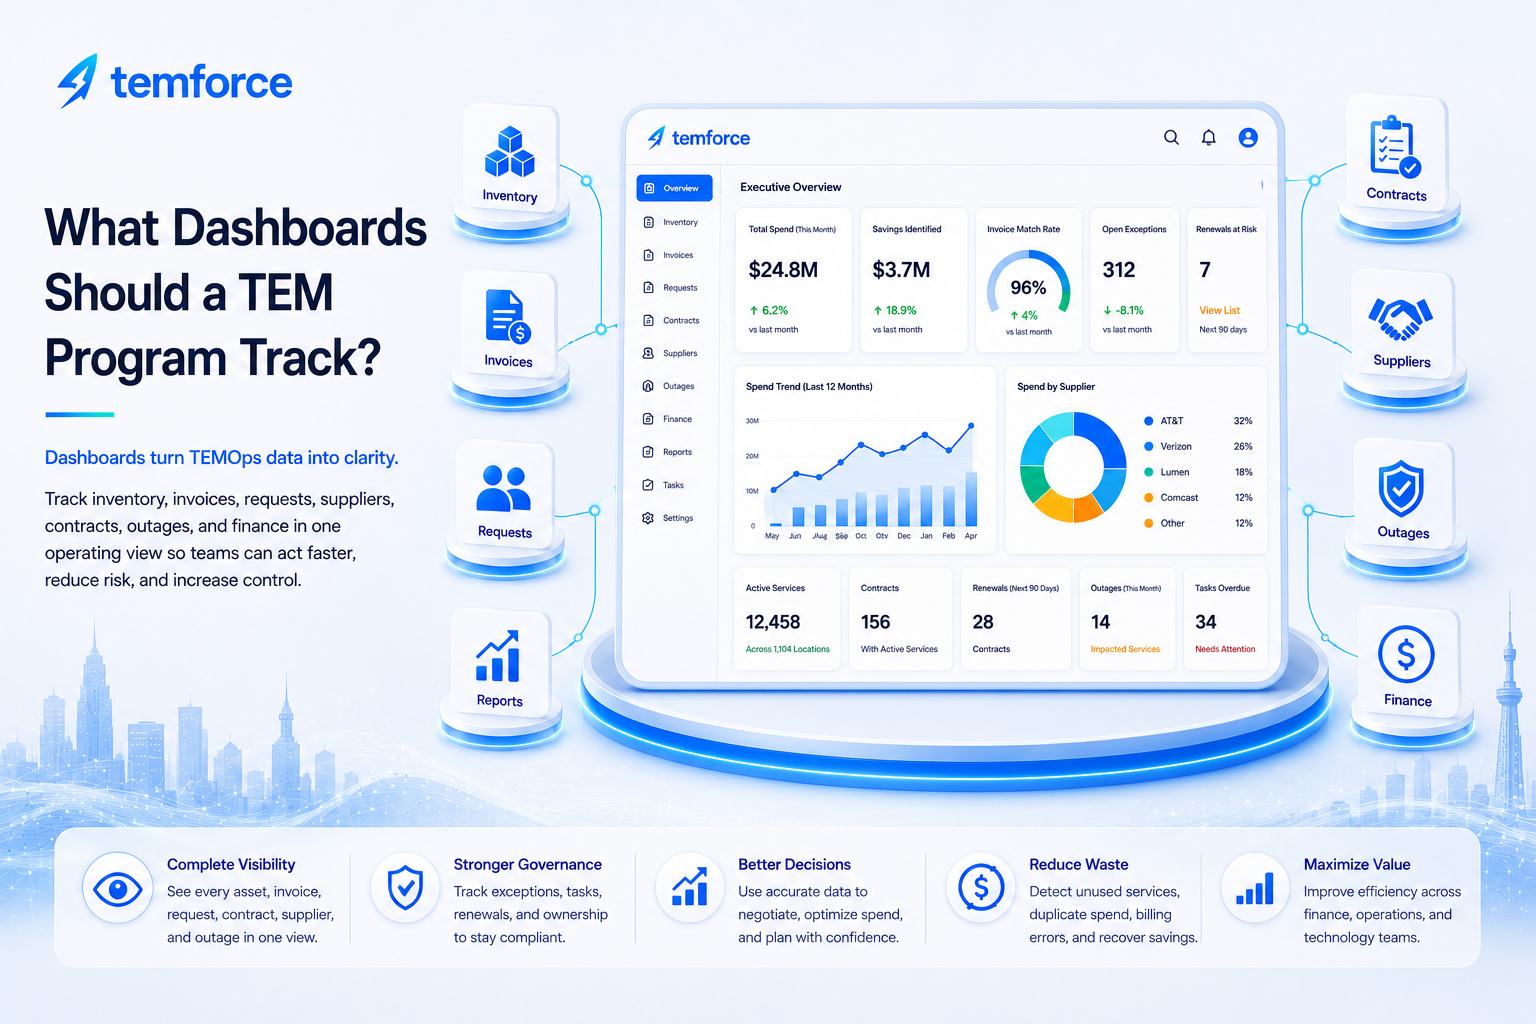
What Dashboards Should a TEM Program Track?
May 28, 2026
Category Management
A TEM program should track dashboards that show inventory accuracy, invoice exceptions, request activity, supplier performance, contract renewals, outage impact, finance allocation, cost management, and operating governance. Dashboards are where TEMOps work becomes visible.
TEM dashboards should not be limited to spend charts. A strong dashboard model connects inventory, invoices, requests, suppliers, contracts, outages, finance, reports, and tasks so teams can understand what is happening, what needs action, and where risk is building.
A dashboard is only useful if it helps the organization make a decision, assign work, reduce risk, validate spend, or improve control. Otherwise, it is just a prettier spreadsheet.
Why TEM dashboards matter
Technology expense management often fails when teams have data but no useful visibility. Inventory may live in one file, invoices in another, disputes in email, contracts in a shared folder, renewals on a calendar, and supplier issues in someone’s inbox.
Dashboards help bring that operating activity into one view so the business can see patterns, prioritize action, and manage technology expense with more confidence.
Dashboards show inventory health, invoice issues, request volume, supplier exposure, renewal risk, outages, and spend movement in one operating view.
A consistent dashboard rhythm helps teams review exceptions, tasks, disputes, renewals, aging items, and ownership gaps before they become bigger problems.
Dashboards expose inactive services, missing owners, unmanaged accounts, renewal deadlines, invoice exceptions, and cost changes that need attention.
When dashboards are structured, teams spend less time rebuilding reports and more time resolving the issues the reports reveal.
A good TEM dashboard should tell the business where to look next. It should not just say spend went up. It should help show whether the increase came from new requests, missing disconnects, supplier changes, contract renewals, billing errors, usage changes, or ownership gaps.
The dashboards a TEM program should track
A strong TEM dashboard model should cover the major operating areas of the program. Each dashboard should connect back to the inventory foundation and support a clear operating action.
| Dashboard | What It Shows | Why It Matters | Action It Should Trigger |
|---|---|---|---|
| Inventory health dashboard | Inventory completeness, missing owners, inactive services, lifecycle status, locations, suppliers, cost centers, and aging records. | Inventory is the foundation of invoice validation, renewals, outages, finance allocation, and reporting. | Assign cleanup tasks, owner reviews, lifecycle updates, and data corrections. |
| Invoice validation dashboard | Matched charges, exceptions, disputes, billing account issues, credits, recurring charge changes, and validation status. | Invoice validation protects the business from unsupported, mispriced, duplicate, or inactive charges. | Open disputes, request credits, update inventory, correct cost centers, or approve valid charges. |
| Request and MACD dashboard | Open requests, moves, adds, changes, disconnects, approvals, pending supplier actions, and completed activity. | Request activity is what keeps inventory current as the business changes. | Follow up on delayed requests, missing approvals, incomplete disconnects, and inventory updates. |
| Contract renewals and expirations dashboard | Upcoming renewals, expirations, notice windows, contract owners, suppliers, renewal risk, and services tied to each contract. | Renewal visibility prevents last-minute decisions and avoidable commitments. | Start renewal reviews, confirm business need, negotiate terms, or plan disconnects. |
| Supplier and outage dashboard | Supplier performance, outages, impacted services, locations, escalation activity, disputes, credits, and service issues. | Supplier issues should be connected to the inventory and services they affect. | Escalate supplier issues, track credits, review performance, and update relationship records. |
| Finance and allocation dashboard | Cost centers, GL codes, chargebacks, unallocated spend, billing accounts, accruals, payment status, and budget variance. | Finance needs clean ownership and allocation data to trust technology expense reporting. | Correct allocation, update owners, resolve missing cost centers, and review variance. |
| Cost management dashboard | Savings opportunities, spend trends, unused services, duplicate services, credits, optimization activity, and avoided cost. | Cost management turns visibility into measurable financial improvement. | Prioritize savings actions, disconnect waste, recover credits, and track outcomes. |
| Executive summary dashboard | Program health, total spend, savings, exceptions, risk, renewal exposure, inventory accuracy, and governance progress. | Leaders need a simplified view of where the program stands and what requires attention. | Guide executive review, investment decisions, staffing priorities, and governance focus. |
How to use TEM dashboards in the operating rhythm
Dashboards should be part of a recurring review cycle. The point is not just to look at the dashboard. The point is to use the dashboard to assign work, close gaps, and strengthen operating control.
Start with inventory health
Review missing owners, inactive services, unknown records, lifecycle gaps, supplier mismatches, location issues, and cost center problems.
Review invoice exceptions
Check unmatched charges, unexpected increases, unresolved disputes, missing credits, billing account issues, and charges without valid inventory context.
Check requests and open tasks
Review pending moves, adds, changes, disconnects, approvals, supplier confirmations, and tasks that must update inventory or finance records.
Look ahead at renewals
Identify contracts approaching renewal, services tied to those contracts, supplier exposure, owner decisions, and optimization opportunities.
Review suppliers and outages
Look at service issues, outage history, impacted locations, escalation activity, credits, disputes, and supplier performance trends.
Turn findings into action
Convert dashboard findings into assigned tasks, owner follow-ups, supplier actions, contract reviews, invoice disputes, and inventory updates.
Metrics every TEM dashboard model should consider
The right metrics depend on the organization, but most TEM programs should track a practical mix of inventory, invoice, supplier, contract, finance, and operating metrics.
- Total technology spend, monthly recurring charges, spend by supplier, spend by category, and spend by cost center
- Inventory completeness, active services, inactive services, missing owners, missing locations, and missing cost centers
- Invoice match rate, invoice exceptions, disputed charges, credits pending, credits recovered, and billing account issues
- Open requests, completed requests, pending approvals, disconnect status, MACD volume, and request aging
- Upcoming renewals, contracts expiring, notice windows, renewal risk, supplier commitments, and contract ownership
- Outage count, impacted services, supplier response, outage duration, escalation activity, and related credits
- Tasks open, tasks overdue, cleanup actions completed, owner follow-ups, supplier follow-ups, and exception aging
- Savings identified, savings approved, savings realized, avoided cost, duplicate services, and unused services
If a dashboard does not help someone make a decision, assign work, confirm control, or reduce risk, it probably needs to be simplified or tied to a clearer operating action.
Common dashboard and reporting issues
TEM dashboards often fall short when they are built around available data instead of operating decisions.
If inventory, invoice, supplier, contract, or finance data is stale, the dashboard may create more questions than confidence.
Dashboards lose value when findings are not converted into tasks, approvals, disputes, renewals, or inventory updates.
Spend charts alone rarely explain whether the increase came from usage, pricing, requests, billing errors, renewals, or inventory drift.
Dashboards need a review rhythm so exceptions, renewals, disputes, and ownership gaps do not sit untouched.
Manual reporting drains time and increases the risk of inconsistent numbers, outdated data, and duplicated effort.
Leadership needs more than total spend. They need visibility into risk, savings, exceptions, renewals, and operating control.
Example scenario: a dashboard that finds the real issue
A monthly spend dashboard shows that network expenses increased. In a weak process, the team may spend hours reviewing invoices and asking suppliers for explanations. In a stronger TEMOps process, dashboards connect the spend increase to recent requests, inventory changes, billing accounts, contract terms, supplier activity, and invoice exceptions.
Instead of asking, “Why did spend go up?” the business asks, “Which services, requests, suppliers, contracts, owners, locations, or invoice exceptions caused the change, and what action should we take?”
How Temforce helps with TEM dashboards and reporting
Temforce helps organizations connect dashboards and reports to the operating records that make technology expense management actionable. Inventory, invoices, requests, suppliers, contracts, outages, finance, cost management, and tasks should work together, not sit in disconnected reports.
The goal is to give teams a clearer operating view of what exists, what is changing, what is being billed, what is at risk, and what needs action.
Build dashboard views around the services, suppliers, owners, locations, billing accounts, contracts, and lifecycle status that define the estate.
Turn invoice exceptions, missing data, supplier issues, renewal risks, and cleanup findings into assigned work.
Support leadership visibility into spend, savings, risk, inventory accuracy, renewals, outages, and operating control.
